
![]() Description of Models
Description of Models
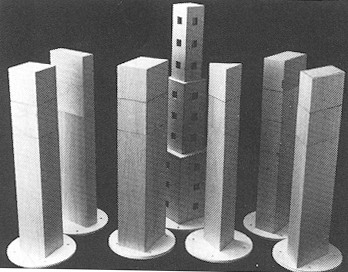
As shown in the table below, 9 building cross sections were modeled. Three different rigid balsa wood models of each cross-section
were constructed, with height of 16, 20 and 24 inches, yielding 27 different model buildings of varying aspect ratio
and shape to investigate the influence of structural dimensions on aerodynamic loads (Kareem 1992).
A photograph of the models used is given in Figure 1.
Note that the center building with variable cross-section and openings belongs to the second phase of this study.
![]() Simulated Wind Tunnel Conditions
Simulated Wind Tunnel Conditions
Each of the balsa models was tested in a boundary layer wind tunnel with a 10 ft (3 m) x 5 ft (1.5 m) cross-section,
of 60 ft (18 m) length (Kareem 1990).
The turbulent boundary layers simulated in this study were generated by the natural action of the surface roughness
added on the tunnel floor and the upstream spires.
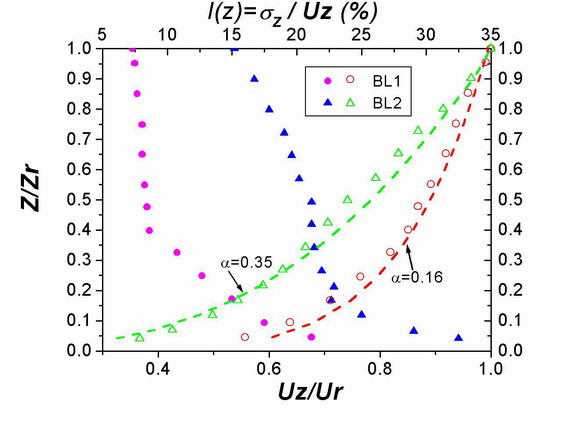
Two typical boundary layers were simulated in this study,
BL1 (a=0.16, where a = exponent of mean wind velocity profile)
and BL2 (a=0.35), similar to the conditions of open and urban flow environments, respectively.
As illustrated by Figure 2, in BL1 there is less variation of the incident mean velocity along the model elevation
accompanied by a lower intensity of turbulence in comparison with BL2.
The boundary layer thickness in BL1 and BL2 was 40 inches and 47 inches, respectively,
while the length scale between the heights of 10 and 30 inches varied from 12 to 20 inches,
and turbulent fluctuations conformed to the prescribed spectral description (Kareem and Cheng 1984).
A constant-temperature hot-film was used to map the flow field characteristics in the tunnel.
![]() Force-Balance Approach
Force-Balance Approach
A high-frequency force balance was then used in conjunction with each balsa wood model
to determine the dynamic wind-induced structural loads, as common to many other studies
(e.g. Kareem & Cermak 1979, Tschanz & Davenport 1983, Reinhold & Kareem 1986 and Boggs & Peterka 1989).
These techniques have dramatically reduced both the time and cost required to obtain estimates of wind loads
and structural response levels. The force balance provides dynamic load information for a specific building geometry
and setting which maybe used to calculate loads and response levels for a wide range of structural characteristics,
damping values, and building masses.
The loads obtained by the force-balance approach or multi-point pressure measurements do not include motion-induced aerodynamic loads.
It is general consensus that in most tall buildings the influence of motion-induced loading is significant
for typical design wind speeds. For exceptionally slender, flexible and lightly damped structures,
one may resort to aeroelastic models or use special motion-induced force measurement systems in conjunction with a force balance.
The force-balance-measured fluctuating base bending moment has a power spectral density given by:
where z is the height above the base level, SP(z1,z2;f) represents the cross spectral density of the aerodynamic load per unit height at z1, z2 and frequency f, and H is the building height. Note, that comparison with the mode generalized force spectrum reveals that the force-balance provides a convenient measure of the generalized force associated with a linear mode shape.
![]() Data Analysis
Data Analysis
The output of the sensitive, multi-component force balance was analyzed, using the FFT,
to determine the spectral and cross-spectral density functions,
which were later non-dimensionalized. This analysis was carried out for all 27 model buildings,
in both boundary layers, and at varying angles of wind incidence, though only the case of 0o will be considered here.
![]() Validation of Data
Validation of Data
A validation of the measured acrosswind spectra was conducted with a model for the acrosswind force on buildings
found in Kareem (1989) based on earlier measurements at a different wind tunnel.
The measurements reported here almost agreed perfectly with this model.
In addition, a confirmation of the results for the torsional loads was also conducted
by comparing the sensitive force balance results, with those found by another technique: pneumatic averaging (Kareem 1990).
This latter technique measures torsional loads by pneumatically averaging the pressure measurements
at five levels on the model face, with the pressure taps clustered on the model to account for the weighting function
needed to introduce the lever arm for torsional response measurements.
Further details may be found in Kareem (1989). Using this approach,
the torsional loads were obtained at the different levels simultaneously
and later synthesized to obtain integral loads according to a desired mode shape
(a uniform mode shape was considered for this comparison).
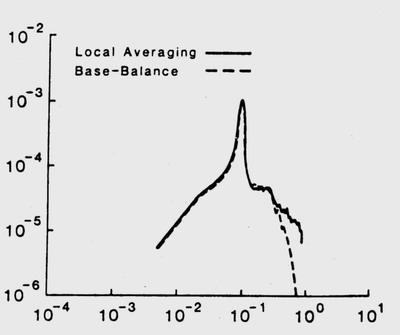
The measured, mode generalized spectra were compared to those obtained from the sensitive high-frequency force balance.
As Figure 3 illustrates, there is good agreement between the two force measurement approaches,
implying the validation of the spatial averaging technique discussed in Kareem (1990).
The minor discrepancy in the high frequency range is not significant for typical design applications
and may be corrected by increasing the number of clusters of tap matrices in the pneumatic averaging case
to account for pressure fluctuations associated with short wavelengths.
All References may be found at Publications Link.
If you have any questions or comments about the content of this site,
please e-mail to Dr. Ahsan Kareem, Dr. Tracy L. Kijewski-Correa or Dr. Dae-Kun Kwon